
-435 Million: Spiders Head to Shore
- Anna Samuels
- Oct 3, 2018
- 3 min read

This week I discovered an exciting digital humanities project that has allowed me to waste time in a productive way. “But Anna, how could such a thing be possible?” you may ask. Allow me to explain the wonders of Histography.
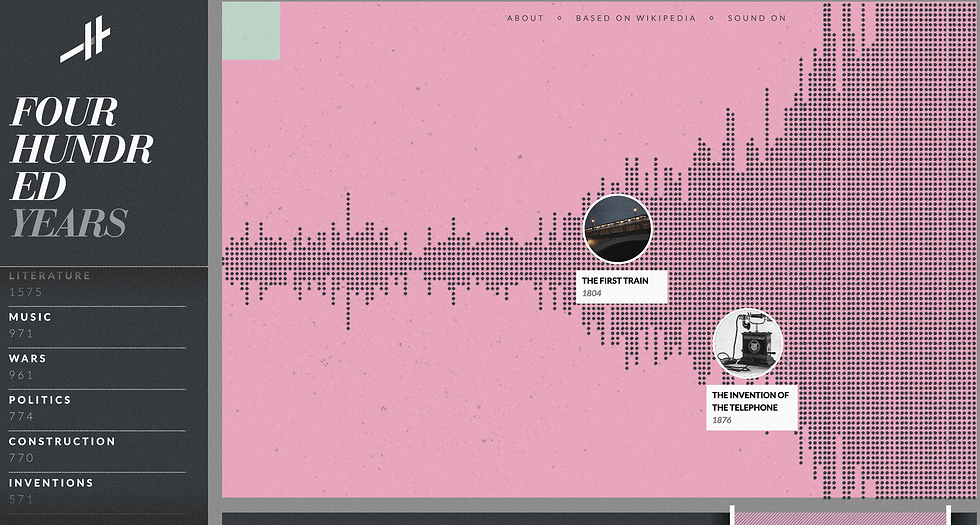
In the words of its creator Matan Stauber (an interactive designer and developer based in Tel Aviv), “Histography is an interactive timeline that spans across 14 billion years of history, from the Big Bang to 2015.” The site welcomes users with a pop up message that provides basic information about the project, namely that each data point represents an event and that the timeline can be resized to display different periods. Users have to dig a little deeper to find out that Stauber’s data is drawn from Wikipedia and that the site self-updates daily. Aside from the initial pop up, a brief instructional video, and a short description of the project found on the “About” page, Stauber assumes that users won’t need much guidance when interacting with his site. For the most part, he’s correct.
Histography provides an appealing visualization of what is most certainly a “Big Data” set. The site also allows users to manipulate Wikipedia’s data by either adjusting the timeline or filtering the articles using a selection of themes displayed to the left. Users can choose to either view all themes at once, select a single theme, or compare two. The site also links directly to Wikipedia pages, displaying content as a pop-up text window. Some of the articles feature embedded video components or a “Related Events” tab which, when clicked, brings up associated articles. In this sense, Histography could be used as a sort of filtered Wikipedia, albeit a version that doesn’t allow you to search for specific articles. Considering the categories set forth in Jeffrey McClurken’s “Digital History Review Guidelines,” I would classify Histography as both a digital exhibit and a gateway/clearinghouse. Depending on how one chooses to utilize the website, it can either function as a digital representation of data or a platform through which users can access external information.
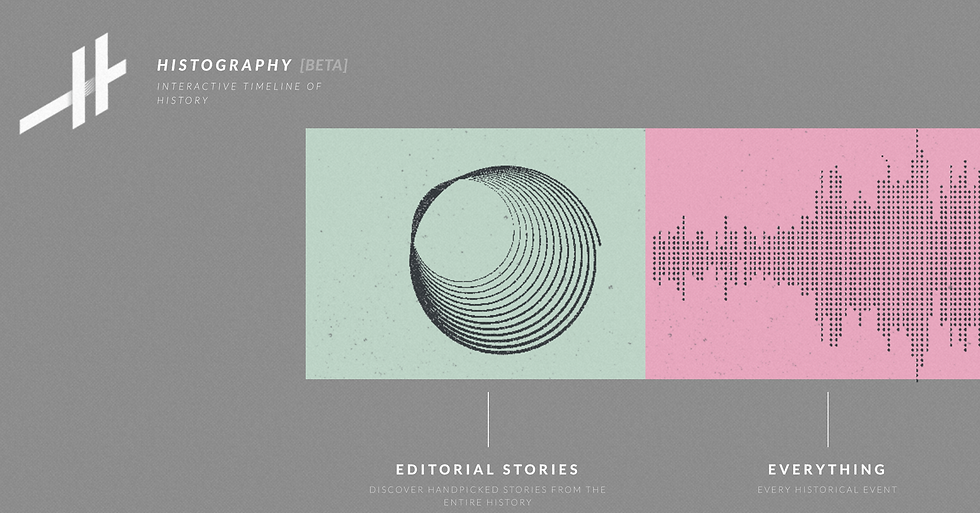
Users have the option to interact with Stauber’s Wikipedia data in two forms: “Editorial Stories” or the aptly titled “Everything.” Like the main page, Editorial Stories also provides a timeline, but here it’s displayed as a spiral instead of a of a linear model. Whereas users can interact with individual articles on the timeline on the main page, when operating in the Editorial Stories interface they must instead select highlighted events from a scroll bar on the left side of the screen. Scrolling back to the beginning of the list, users can select stories such as “The Sun Starts to Produce Energy” in -4.5 Billion or the terrifying “Spiders Head to Shore” in -435 Million. The list combined with the “time spiral” is a pleasing visual but not as interactive as the main timeline.
Stauber created Histography as a final project while enrolled at Bezalel Academy of Arts and Design in Jerusalem, so I assume that the initial audience were other academics and designers. However, the project is featured in Slate writer Rebecca Onion’s “Five Digital History Projects That Dazzled Us in 2015,” so it seems that there’s been some public crossover as well. It’s no surprise that the site was created by someone with an arts and design background. Stauber has accomplished quite a feat by sharing an impressive amount of information in a clean, modern format which appears at first glance to be relatively simple.
On the surface, Histography is an interactive timeline that makes fun noises (Onion agrees). On a second level, we can see it as a commentary on our overproduction of information, particularly in the site’s reliance on encyclopedic systems of knowledge. Deeper still, we can read this project as a digital analysis of Wikipedia’s user-generated and regulated content. It’s not that we have to doubt the veracity of Stauber’s (borrowed) data, but we do have to acknowledge its inherent gaps. In an interview with SmashingMag, Stauber explains, “All the data I'm using comes from the English Wikipedia (which is the biggest data source) and in many ways this information represents the Western view of history.”
Though it sometimes sacrifices ease of use for design, Histography’s striking visualizations encourage users to engage with Wikipedia as an information source while also commenting on our concepts of time, progress, and information. I look forward to productively wasting time with this project in the future.

Comments