
Visualization and Aurality: Tracking Data Trends in Oral History Transcripts
- Anna Samuels
- Nov 19, 2018
- 4 min read

“Which is oral history, the recording or transcript?,” Donald Ritchie asks in his classic guide to the discipline, Doing Oral History (54). Ritchie’s question is one that oral historians have long debated. There are obvious benefits to both mediums: transcripts are easier to skim, a task that, unless the audio files are indexed, is near impossible when working with a recording. Audio of an interview, on the other hand, is a pure representation of a dialogue; a transcript is one person’s interpretation. In preparation for the final project for our “Digital Humanities and the Historian” course this semester, a digital exhibit that will showcase Duquesne’s Veterans’ Oral History project, oral historian Megan DeFries shared nine audio files and transcripts of interviews she has conducted with veteran narrators. Since I’ve been working closely with the transcripts, I thought it would be interesting to focus on them for this week’s visualization assignment.
I started by looking at all of the transcripts together and decided to use Voyant for this exercise because I felt moderately comfortable with its functions. Before uploading the transcripts, I cleaned my data by deleting all timestamps and any additional information provided by the transcriptionist. This process, though time consuming, was incredibly simple because all additional information was offset by square brackets, making it easy to find and delete. However, I did not delete indications of emotional response from the interviewer or narrator, such as laughter. I thought these instances would reveal insights into interviewer/narrator rapport, but I later realized that the only thing they revealed was that most people laugh in interviews! I chose not to spend my time contextualizing each laugh—Was it nervous? Jovial? Conspiratorial?—though I do think that analyzing vocal affirmations apart from words may reveal interesting patterns. I would argue that my corpus, though not incredibly lengthy, can still be considered “big data.” I could read all nine transcripts without too much effort, but being able to track the themes and correlations between them would be difficult.

I started out with everybody’s favorite—a word cloud! This was a simple visualization which provided me with a basic understanding of the data I had. I began working on my stopwords, starting with “DeFries” and each narrator’s last name. From there, I let the word cloud guide me. I took out all small, insignificant words and words I knew would be repeated throughout each interview (things like “yeah,” “okay,” “think,” etc). After submitting my new list of stopwords, I’d let the word cloud reform and start again. The word cloud for all the transcripts combined (see above) doesn’t look particularly interesting at first glance, but its content tells us a lot about the VOHP narratives. Though these interviews focus almost exclusively on military service, the most commonly used words don’t have anything to do with war. This trend was also evident in the transcripts I analyzed on their own. Words like “people,” “home,” “school,” and “remember” suggest that narrators wanted to talk about their relationships with people and life before and after the war as opposed to specific wartime experiences. This may also have something to do with the way Megan posed questions.
Next I compared smaller groups of transcripts to see if I could find any interesting data patterns. I uploaded both of the WWII narratives into Voyant and then did the same with the Vietnam narratives. I chose to use the MicroSearch visualization option because I liked the way that it provided context for where terms appeared in the transcript. The MicroSearch visualization also provides information regarding the length of each document, which is pertinent when analyzing oral history transcripts. I input words relating to war and conflict into the MicroSearch visualization for the WWII and Vietnam narratives and compared my findings.


The top image shows instances of military-related terms in four Vietnam interviews. The bottom image shows the same for two WWII interviews.
The visualization reveals that the WWII and Vietnam narrators used a similar amount of words related to war and combat in their interviews. We also see that references to war are spread evenly throughout the transcripts. A possible discrepancy with this data is the fact that Megan probably asked questions about war and service in the interview. Though I could remove all of her questions and analyze only the narrators’ responses, I would feel uncomfortable representing a collaborative oral history interview as one-sided.
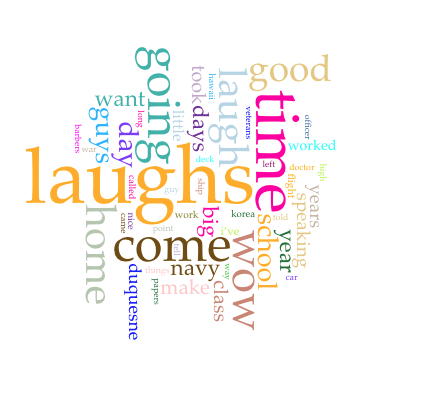
For my final visualization, I compared the two remaining narratives, one of which featured the project’s sole female narrator, and wondered if I might discover something about gendered speech and conversation patterns. I noticed that the female narrator (left image) used more concrete terms in her narrative, such as “pharmacists,” “military,” duty,” “business,” and “navy.” The male narrator (right image), on the other hand, used more generalized language. However, these differences in narrative patterns may reflect the fact the female narrator was never deployed. It may be easier for this narrator to discuss service experiences than the other narrator, who was deployed and served in the Korean War. Clearly it can be dangerous to make assumptions about language patterns when a variety of attributes can affect narrative style.

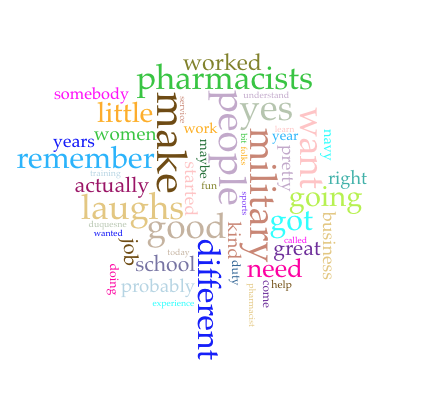

Left: Word cloud visualization of female veteran's narrative
Right: Word cloud visualization of male veteran's narrative
All of my visualizations fall into the “exploration” category, that is, I used them to illuminate data and connections. The word clouds also helped me to identify problems with my data, another visualization benefit identified in Exploring Big Historical Data (160). When I discovered that “time” was one of the most used words in my corpus I thought I had discovered an important trend, but then remembered that the phrase “speaking at the same time” is used in the transcripts whenever the interviewer and narrator interrupt each other, which is quite often. This is an instance in which a word cloud would have led me astray because, as Big Historical Data reminds its readers, they don’t provide context (74). Though at this point my visualizations have only resulted in hypotheses, focusing on text and individual words was an interesting exercise that I hope will influence the way I interact with transcripts moving forward.
Works Cited
Graham, Shawn, Ian Milligan, and Scott Weingart. Exploring Big Historical Data. London: Imperial College Press, 2015.
Ritchie, Donald. Doing Oral History. New York: Oxford University Press, 2015.
Comments